As James noted in the comment. You can use the .draw( output = 'mpl', ... ) or to help you to get a nicer figure. That is, suppose I have the following circuit:
q_0: ┤ X ├┤M├─────────
     ├───┤└╥┘┌─┐
q_1: ┤ X ├─╫─┤M├──────
     ├───┤ ║ └╥┘┌─┐
q_2: ┤ H ├─╫──╫─┤M├───
     ├───┤ ║  ║ └╥┘┌─┐
q_3: ┤ H ├─╫──╫──╫─┤M├
     └───┘ ║  ║  ║ └╥┘
c: 4/══════╩══╩══╩══╩═
           0  1  2  3
which can be created by running the code:
from qiskit import QuantumRegister, ClassicalRegister, QuantumCircuit
from numpy import pi

qreg_q = QuantumRegister(4, 'q')
creg_c = ClassicalRegister(4, 'c')
circuit = QuantumCircuit(qreg_q, creg_c)

circuit.x(qreg_q[0])
circuit.x(qreg_q[1])
circuit.h(qreg_q[2])
circuit.h(qreg_q[3])
circuit.measure(qreg_q[0], creg_c[0])
circuit.measure(qreg_q[1], creg_c[1])
circuit.measure(qreg_q[2], creg_c[2])
circuit.measure(qreg_q[3], creg_c[3])
then by specifying:
circuit.draw( output = 'mpl', style={'name': 'bw'}, plot_barriers= True, initial_state = True, scale = 1)
I will get the figure:
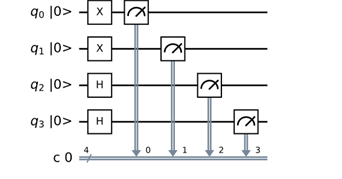
and if i specify:
circuit.draw( output = 'latex',style={'name': 'bw'}, plot_barriers= True, initial_state = True, scale = 1)
I will get the figure:
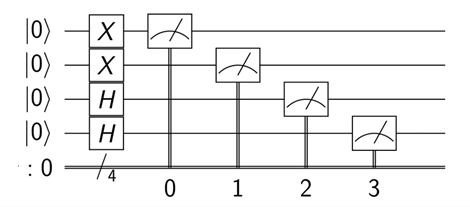
and if you want to save the image file, then include the file name in the option. That is, something like:
circuit.draw( 'mpl',style={'name': 'bw'},filename= 'MyCircuit', plot_barriers= True, initial_state = True, scale = 1)

