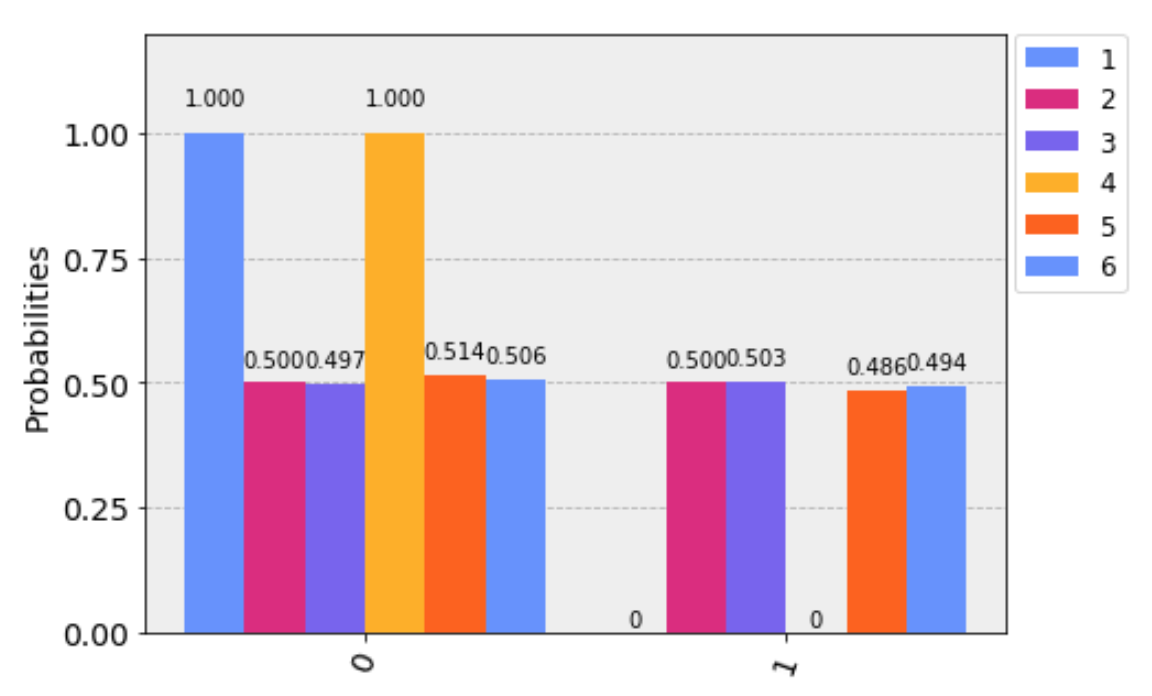
I have tried to plot a histogram for the multiple circuits for the code given below. I think I have done it correctly but don't know why it's not working. Please help me out. If possible please solve it for the Bloch sphere also
# quantum_phase_bloch.py
import numpy as np
from qiskit.visualization import plot_histogram
from qiskit.tools.monitor import job_monitor
from matplotlib import style
from qiskit import QuantumCircuit, QuantumRegister, ClassicalRegister, execute, Aer
from qiskit.tools.visualization import plot_bloch_vector

# Define the Quantum and Classical Registers
q = QuantumRegister(1)
c = ClassicalRegister(1)

# Build the circuits
pre = QuantumCircuit(q, c)
pre.h(q)
pre.barrier()

meas_x = QuantumCircuit(q, c)
meas_x.barrier()
meas_x.h(q)
meas_x.measure(q, c)

meas_y = QuantumCircuit(q, c)
meas_y.barrier()
meas_y.s(q).inverse()
meas_y.h(q)
meas_y.measure(q, c)

meas_z = QuantumCircuit(q, c)
meas_z.barrier()
meas_z.measure(q, c)

bloch_vector = ['x', 'y', 'z']
exp_vector = range(0, 2)
circuits = []
print(len(exp_vector))
for exp_index in exp_vector:
    middle = QuantumCircuit(q, c)
    phase = 2*np.pi*exp_index/(len(exp_vector)-1)
    middle.u1(phase, q)
    circuits.append(pre + middle + meas_x)
    circuits.append(pre + middle + meas_y)
    circuits.append(pre + middle + meas_z)
print(len(circuits))

# Execute the circuit
job = execute(circuits, backend = Aer.get_backend('qasm_simulator'), shots=1024)
result = job.result()

# trying to plot histogram
counts = []
# count = np.zeros([0])

for x in range(len(circuits)):
#     count[x] = result.get_counts(circuits[x])
    count = result.get_counts(circuits[x])
    counts.append(count)

plot_histogram(counts , legend=['1','2','3','4','5','6'])
print(counts)

