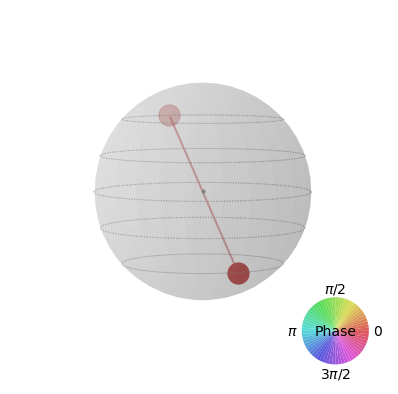
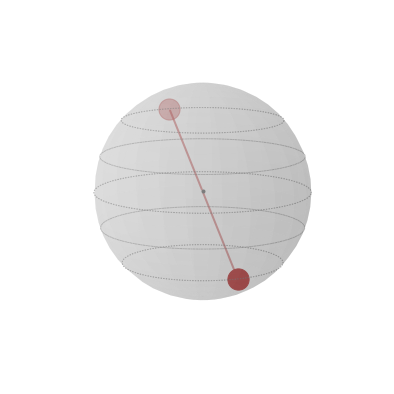
Trying to plot the Bloch Sphere of the IBM Qiskit logo
from qiskit import execute, Aer, IBMQ, QuantumCircuit
from qiskit.quantum_info import Statevector
from qiskit.visualization import plot_state_qsphere, plot_bloch_multivector
%matplotlib inline

# no. of qubits
n = 4

# create circuit
qc = QuantumCircuit(n)

# apply hadamard
qc.h(0)

# apply cnot
for i in range(n-1):
    qc.cx(0, i+1)

# apply not on q1
qc.x(1)

# get state vector
sv = Statevector.from_instruction(qc).data

# plots
plot_state_qsphere(sv)
plot_bloch_multivector(sv)
Why the Bloch Sphere does not have any state representations?
Circuit link


plot_bloch_multivectoris for visualizing the individual qubits. It works for other circuits. What am I missing here? $\endgroup$