increase similarity
Source Link
luciano
  • 6k
  • 1
  • 13
  • 34

As @PaulNation explained, the bloch spheres represent maximally entangled qubits as zero-length vectors. Hence, no arrows.

The Qiskit logo is a qsphere of a particular statevector. In particular, a 6-qubit state, according to Abe:

from qiskit.visualization import plot_state_qsphere
state = [0]*2**6
state[2] = 1; state[61] = 1
plot_state_qsphere(state, show_state_labels=False)

qiskit logo qsphere

So... you are actually really really close. Just change n = 6 I you will get it!

Here is your fixed code:

from qiskit import QuantumCircuit
from qiskit.quantum_info import Statevector
from qiskit.visualization import plot_state_qsphere

n = 6
qc = QuantumCircuit(n)
qc.h(0)
for i in range(n-1):
    qc.cx(0, i+1)
qc.x(1)

sv = Statevector.from_instruction(qc)
plot_state_qsphere(sv, show_state_labels=False)

qiskit logo qsphere

To increase the similarity, delete the legend and modify the elevation:

fig = plot_state_qsphere(sv, show_state_labels=False)
fig.axes[0].view_init(elev=11, azim=275)
fig.axes[1].set_visible(False)
fig

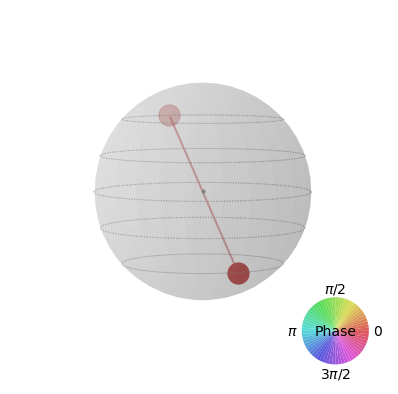
enter image description here

As @PaulNation explained, the bloch spheres represent maximally entangled qubits as zero-length vectors. Hence, no arrows.

The Qiskit logo is a qsphere of a particular statevector. In particular, a 6-qubit state, according to Abe:

from qiskit.visualization import plot_state_qsphere
state = [0]*2**6
state[2] = 1; state[61] = 1
plot_state_qsphere(state, show_state_labels=False)

qiskit logo qsphere

So... you are actually really really close. Just change n = 6 I you will get it!

Here is your fixed code:

from qiskit import QuantumCircuit
from qiskit.quantum_info import Statevector
from qiskit.visualization import plot_state_qsphere

n = 6
qc = QuantumCircuit(n)
qc.h(0)
for i in range(n-1):
    qc.cx(0, i+1)
qc.x(1)

sv = Statevector.from_instruction(qc)
plot_state_qsphere(sv, show_state_labels=False)

qiskit logo qsphere

To increase the similarity, delete the legend and modify the elevation:

fig = plot_state_qsphere(sv, show_state_labels=False)
fig.axes[0].view_init(elev=11, azim=275)
fig.axes[1].set_visible(False)
fig
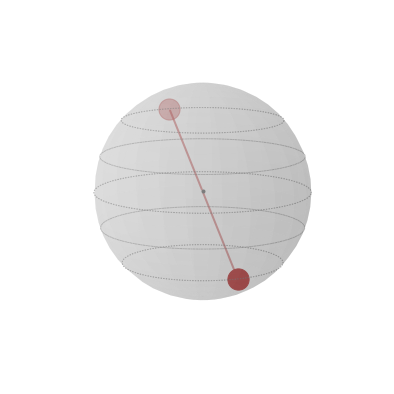
enter image description here

link to the comment
Source Link
luciano
  • 6k
  • 1
  • 13
  • 34

According to AbeAs @PaulNation explained, the bloch spheres represent maximally entangled qubits as zero-length vectors. Hence, no arrows.

The Qiskit logo comes from thisis a qsphere of a particular statevector. In particular, a 6-qubit statevectorstate, according to Abe:

from qiskit.visualization import plot_state_qsphere
state = [0]*2**6
state[2] = 1; state[61] = 1
plot_state_qsphere(state, show_state_labels=False)

qiskit logo qsphere

So... you are actually really really close. Just change n = 6 I you will get it!

Here is your fixed code:

from qiskit import QuantumCircuit
from qiskit.quantum_info import Statevector
from qiskit.visualization import plot_state_qsphere

n = 6
qc = QuantumCircuit(n)
qc.h(0)
for i in range(n-1):
    qc.cx(0, i+1)
qc.x(1)

sv = Statevector.from_instruction(qc)
plot_state_qsphere(sv, show_state_labels=False)

qiskit logo qsphere

According to Abe, the Qiskit logo comes from this 6-qubit statevector:

from qiskit.visualization import plot_state_qsphere
state = [0]*2**6
state[2] = 1; state[61] = 1
plot_state_qsphere(state, show_state_labels=False)

qiskit logo qsphere

So... you are actually really really close. Just change n = 6 I you will get it!

Here is your fixed code:

from qiskit import QuantumCircuit
from qiskit.quantum_info import Statevector
from qiskit.visualization import plot_state_qsphere

n = 6
qc = QuantumCircuit(n)
qc.h(0)
for i in range(n-1):
    qc.cx(0, i+1)
qc.x(1)

sv = Statevector.from_instruction(qc)
plot_state_qsphere(sv, show_state_labels=False)

qiskit logo qsphere

As @PaulNation explained, the bloch spheres represent maximally entangled qubits as zero-length vectors. Hence, no arrows.

The Qiskit logo is a qsphere of a particular statevector. In particular, a 6-qubit state, according to Abe:

from qiskit.visualization import plot_state_qsphere
state = [0]*2**6
state[2] = 1; state[61] = 1
plot_state_qsphere(state, show_state_labels=False)

qiskit logo qsphere

So... you are actually really really close. Just change n = 6 I you will get it!

Here is your fixed code:

from qiskit import QuantumCircuit
from qiskit.quantum_info import Statevector
from qiskit.visualization import plot_state_qsphere

n = 6
qc = QuantumCircuit(n)
qc.h(0)
for i in range(n-1):
    qc.cx(0, i+1)
qc.x(1)

sv = Statevector.from_instruction(qc)
plot_state_qsphere(sv, show_state_labels=False)

qiskit logo qsphere

Source Link
luciano
  • 6k
  • 1
  • 13
  • 34

According to Abe, the Qiskit logo comes from this 6-qubit statevector:

from qiskit.visualization import plot_state_qsphere
state = [0]*2**6
state[2] = 1; state[61] = 1
plot_state_qsphere(state, show_state_labels=False)

qiskit logo qsphere

So... you are actually really really close. Just change n = 6 I you will get it!

Here is your fixed code:

from qiskit import QuantumCircuit
from qiskit.quantum_info import Statevector
from qiskit.visualization import plot_state_qsphere

n = 6
qc = QuantumCircuit(n)
qc.h(0)
for i in range(n-1):
    qc.cx(0, i+1)
qc.x(1)

sv = Statevector.from_instruction(qc)
plot_state_qsphere(sv, show_state_labels=False)

qiskit logo qsphere