4
$\begingroup$

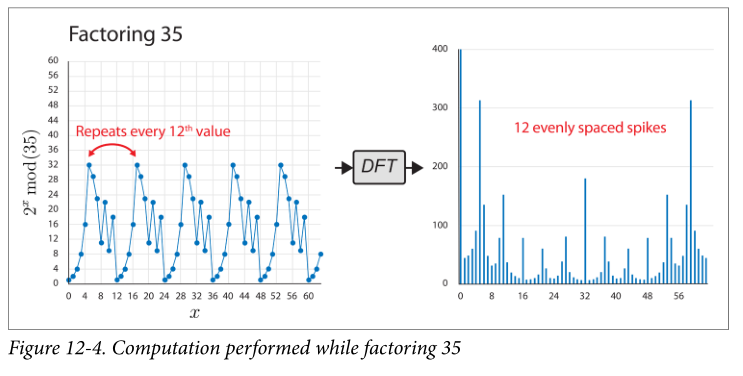
I'm reading Programming Quantum Computers trying to understand Shor's algorithm. I learned there that we prepare a state $|x^i \bmod N\rangle$, then apply the QFT to this state. The QFT changes the amplitudes from a uniform superposition to large amplitudes evenly spaced out by the period of $x^i \bmod N$. For example, here's a graph of the amplitudes after applying the QFT with $N = 35$. That's on page 241.

enter image description here

The book says there are 12 spikes evenly spaced. I see a lot more than 12 spikes evenly spaced. Should I count just the highest ones and stop when I've counted 12? But isn't that subjective? How would I figure out that the number is really 12 from just looking at this graph without knowing the right answer? (In other words, how do I get 12 out of this?)

$\endgroup$
3
  • $\begingroup$ @MariiaMykhailova, you can probably answer this. And --- thanks --- if you do! $\endgroup$
    – user14021
    Commented Dec 5, 2020 at 14:53
  • 1
    $\begingroup$ You're right to count the local maxima. And you're right that it's subjective, but the point is that if you run the modular exponentiation and the QFT, say, $k$ times, you'll get $x_1, x_2,\ldots x_k$, with each $x_i$ likely corresponding to one of the local maxima. You can feed these to the classical parts of the algorithm. $\endgroup$ Commented Dec 5, 2020 at 16:13
  • $\begingroup$ That makes some sense, but it's not clear to me still. By the way, I know the continued fraction algorithm, but it's not clear how to use it to get the period here yet. I asked a question on this. Perhaps you could answer it. Thanks! $\endgroup$
    – user14021
    Commented Dec 5, 2020 at 16:53

1 Answer 1

3
$\begingroup$

Looking at the graphs you've reproduced, the left graph shows the evaluation of $2^x\bmod 35$ for $x\in\{0,\dots 63\}$ while the right graph illustrates the amplitude of the discrete Fourier transform for $\hat{x}\in\{0,\dots 63\}$. The comment that there are "12 evenly spaced spikes" indicates that the local maxima of the right graph repeat every $64/12=5.33$ values.

You are correct, you do not have access to $\hat{x}$ in a manner that lets you observe this periodicity in $\hat{x}$ immediately; however, what you do have access to is a way to sample $\hat{x}_i$ for multiple $i$ in a manner that returns $\hat{x}_i$ with probability given by the (square of the) height of the respective $\hat{x}_i$.

For example, if you were to run the modular exponentiation (left graph) followed by the QFT (right graph), and sample the first register, you are likely to get a value such as $0$ with higher probability than $5$, with higher probability than $32$, with higher probability than $11$, with higher probability than $6$, etc.

From these respective samplings of $\hat{x}_i$, you can run the classical portions (the continued fraction portion) of Shor's algorithm to deduce that, indeed, there were 12 evenly spaced spikes in $\hat{x}$, giving you the period of $12$ in $2^x\bmod 35$. There are a lot of details that I'm forgetting but the point is that you use the samples from your QFT as inputs to this classical portion.

$\endgroup$

Your Answer

By clicking “Post Your Answer”, you agree to our terms of service and acknowledge you have read our privacy policy.

Not the answer you're looking for? Browse other questions tagged or ask your own question.