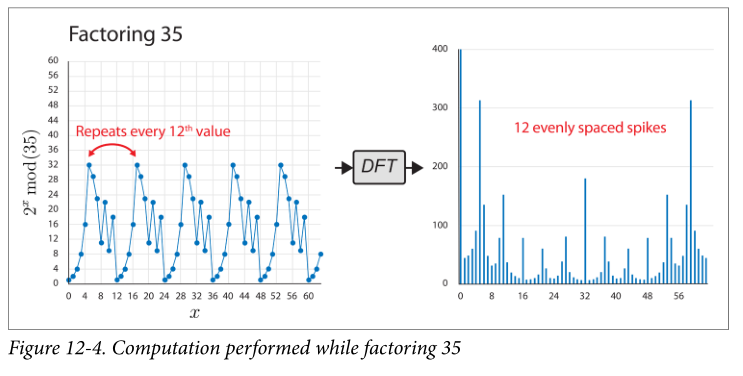
I asked about how to identify the period looking at a Fourier transform plot. The answer seems to be to run the fourier transform multiple times getting multiple values associated to high probabilities described by the graph. So still using the same picture, suppose I read it twice and I got the values |5> and |11>. These are the highest spikes (after the first highest in |0>.) How would I figure out the period 12 out of 5 and 11? Can you show an example of the calculation?
An attempted solution. Reading Peter Shor's paper (on page 320), we find that his $q$ is $q=64$ here in our example. Shor is saying we can obtain a fraction $d/r$ in lowest terms (where $r = 12$ here) by rounding $c/q$ to the nearest fraction having a denominator smaller than $n=35$ here. Our possible $c$ here is $5$ and $11$.
Let's try that. After the QFT, we got $c = 5$ and we have $q = 64$. So we get $5/64 = 0.078125$ and we want to round that to the nearest fraction having a denominator smaller than $35$. For $5/64$, I find the continued fraction $[0,12,1,4]$. (I checked that $5/64 = 1/(12 + 1/(1 + 1/4))$, so that's correct.) Now, from this continued fraction (in list form) I get the following sequence of fractions: $1/4, 5/4, 64/5, 5/64$. (I'm not sure what I'm doing.) Perhaps $5$ is bad luck? But, no, trying the same thing with $11$ will also produce $11/64$. So even though I know how to compute the continued fraction algorithm, I don't know what to do with it. I'm gonna have to look at Hardy and Wright, Chapter X.

