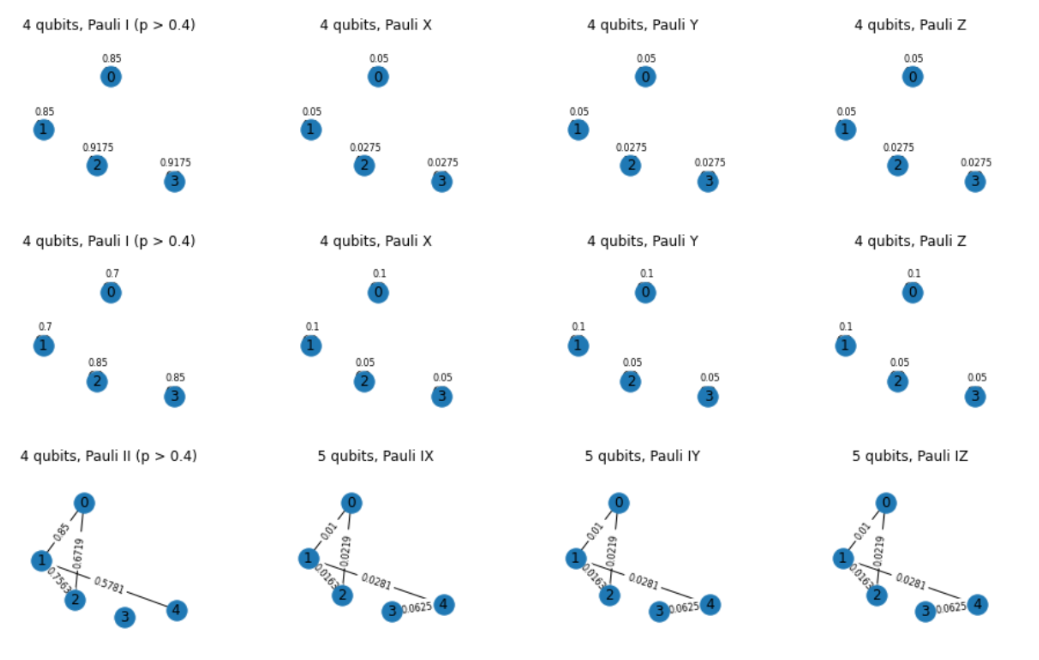
I have the calibration data of an Ibm backend and now I want to plot the error map of the device at that specific time. How can I do this?
2 Answers
You can load the calibration data into the corresponding fake backend. The following function does that
from qiskit.providers.fake_provider.fake_backend import FakeBackendV2

def load_calibrations(self, calibrations_csv):
    if self._props_dict is None:
        self._set_props_dict_from_json()

    prop_names = ['T1', 'T2', 'frequency', 'anharmonicity', 'readout_error', 'prob_meas0_prep1', 'prob_meas1_prep0', 'readout_length']
    gate_names = ['id', 'sx', 'x']
    import csv
    with open(calibrations_csv) as csvfile:
        reader = csv.reader(csvfile)
        for idx, row in enumerate(reader):
            if idx == 0:
                continue
            index = int(row[0])
            for node in self._props_dict['qubits'][index]:
                for prop_index, prop_name in enumerate(prop_names):
                    if node['name'] == prop_name:
                        node['value'] = float(row[prop_index + 1])

            # Single-qubit gate errors:
            for node in self._props_dict['gates']:
                if node['qubits'] == [index]:
                    for gate_index, gate_name in enumerate(gate_names):
                        if node['gate'] == gate_name:
                            for param in node['parameters']:
                                if param['name'] == 'gate_error':
                                    param['value'] = float(row[gate_index + 9])

            # CNOT error:
            for s in row[12].split(';'):
                key, val = s.strip().split(':')
                idxs = key.split('_')
                for node in self._props_dict['gates']:
                    if node['qubits'] == [int(idxs[0]), int(idxs[1])] and node['gate'] == 'cx':
                        for param in node['parameters']:
                                if param['name'] == 'gate_error':
                                    param['value'] = float(val)

            # CNOT gate time:
            for s in row[13].split(';'):
                key, val = s.strip().split(':')
                idxs = key.split('_')
                for node in self._props_dict['gates']:
                    if node['qubits'] == [int(idxs[0]), int(idxs[1])] and node['gate'] == 'cx':
                        for param in node['parameters']:
                                if param['name'] == 'gate_length':
                                    param['value'] = float(val)

# Monkey patch FakeBackendV2 class
setattr(FakeBackendV2, 'load_calibrations', load_calibrations)
* Code is taken from this blog post
After calling this function you can use plot_error_map with this fake backend instance. Assuming IBM backend is ibm_perth, your code should be:
from qiskit.providers.fake_provider import FakePerth
from qiskit.visualization import plot_error_map

cal_file_path = '/path/to/calibrations.csv'

backend = FakePerth()
backend.load_calibrations(cal_file_path)
plot_error_map(backend)
-
$\begingroup$ Thank you so much for response. I saved the calibration data as .npy shall I convert to csv format? $\endgroup$– Shil SCommented Sep 16, 2023 at 7:37
-
$\begingroup$ Yes! Convert npy to csv and try the code. And please if it does not work, share the result with me. $\endgroup$ Commented Sep 16, 2023 at 7:44
-
$\begingroup$ It is working when I use csv format file. But I couldn't convert my npy format file to csv! Can I share my npy file with you? $\endgroup$– Shil SCommented Sep 16, 2023 at 7:58
-
$\begingroup$ Sure. You can contact me in Qiskit's Slack Channel. $\endgroup$ Commented Sep 16, 2023 at 8:10
One way to achieve this (for a depolarisation noise model) is to define a graph, where:
nodes => qubits
edges => probability of a noise Pauli operator.
This example was created by converting the qobj JSON data into the Python networkx format:

