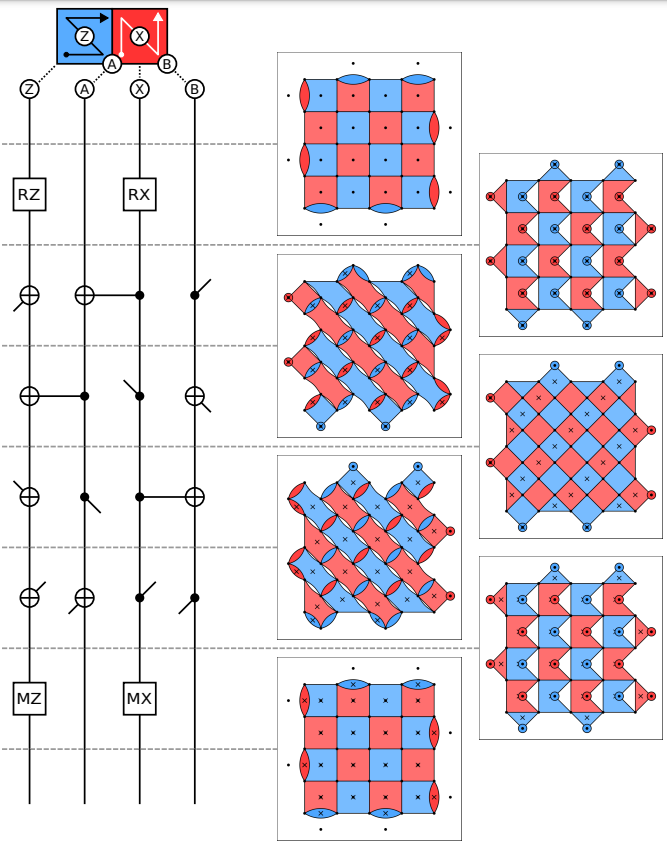
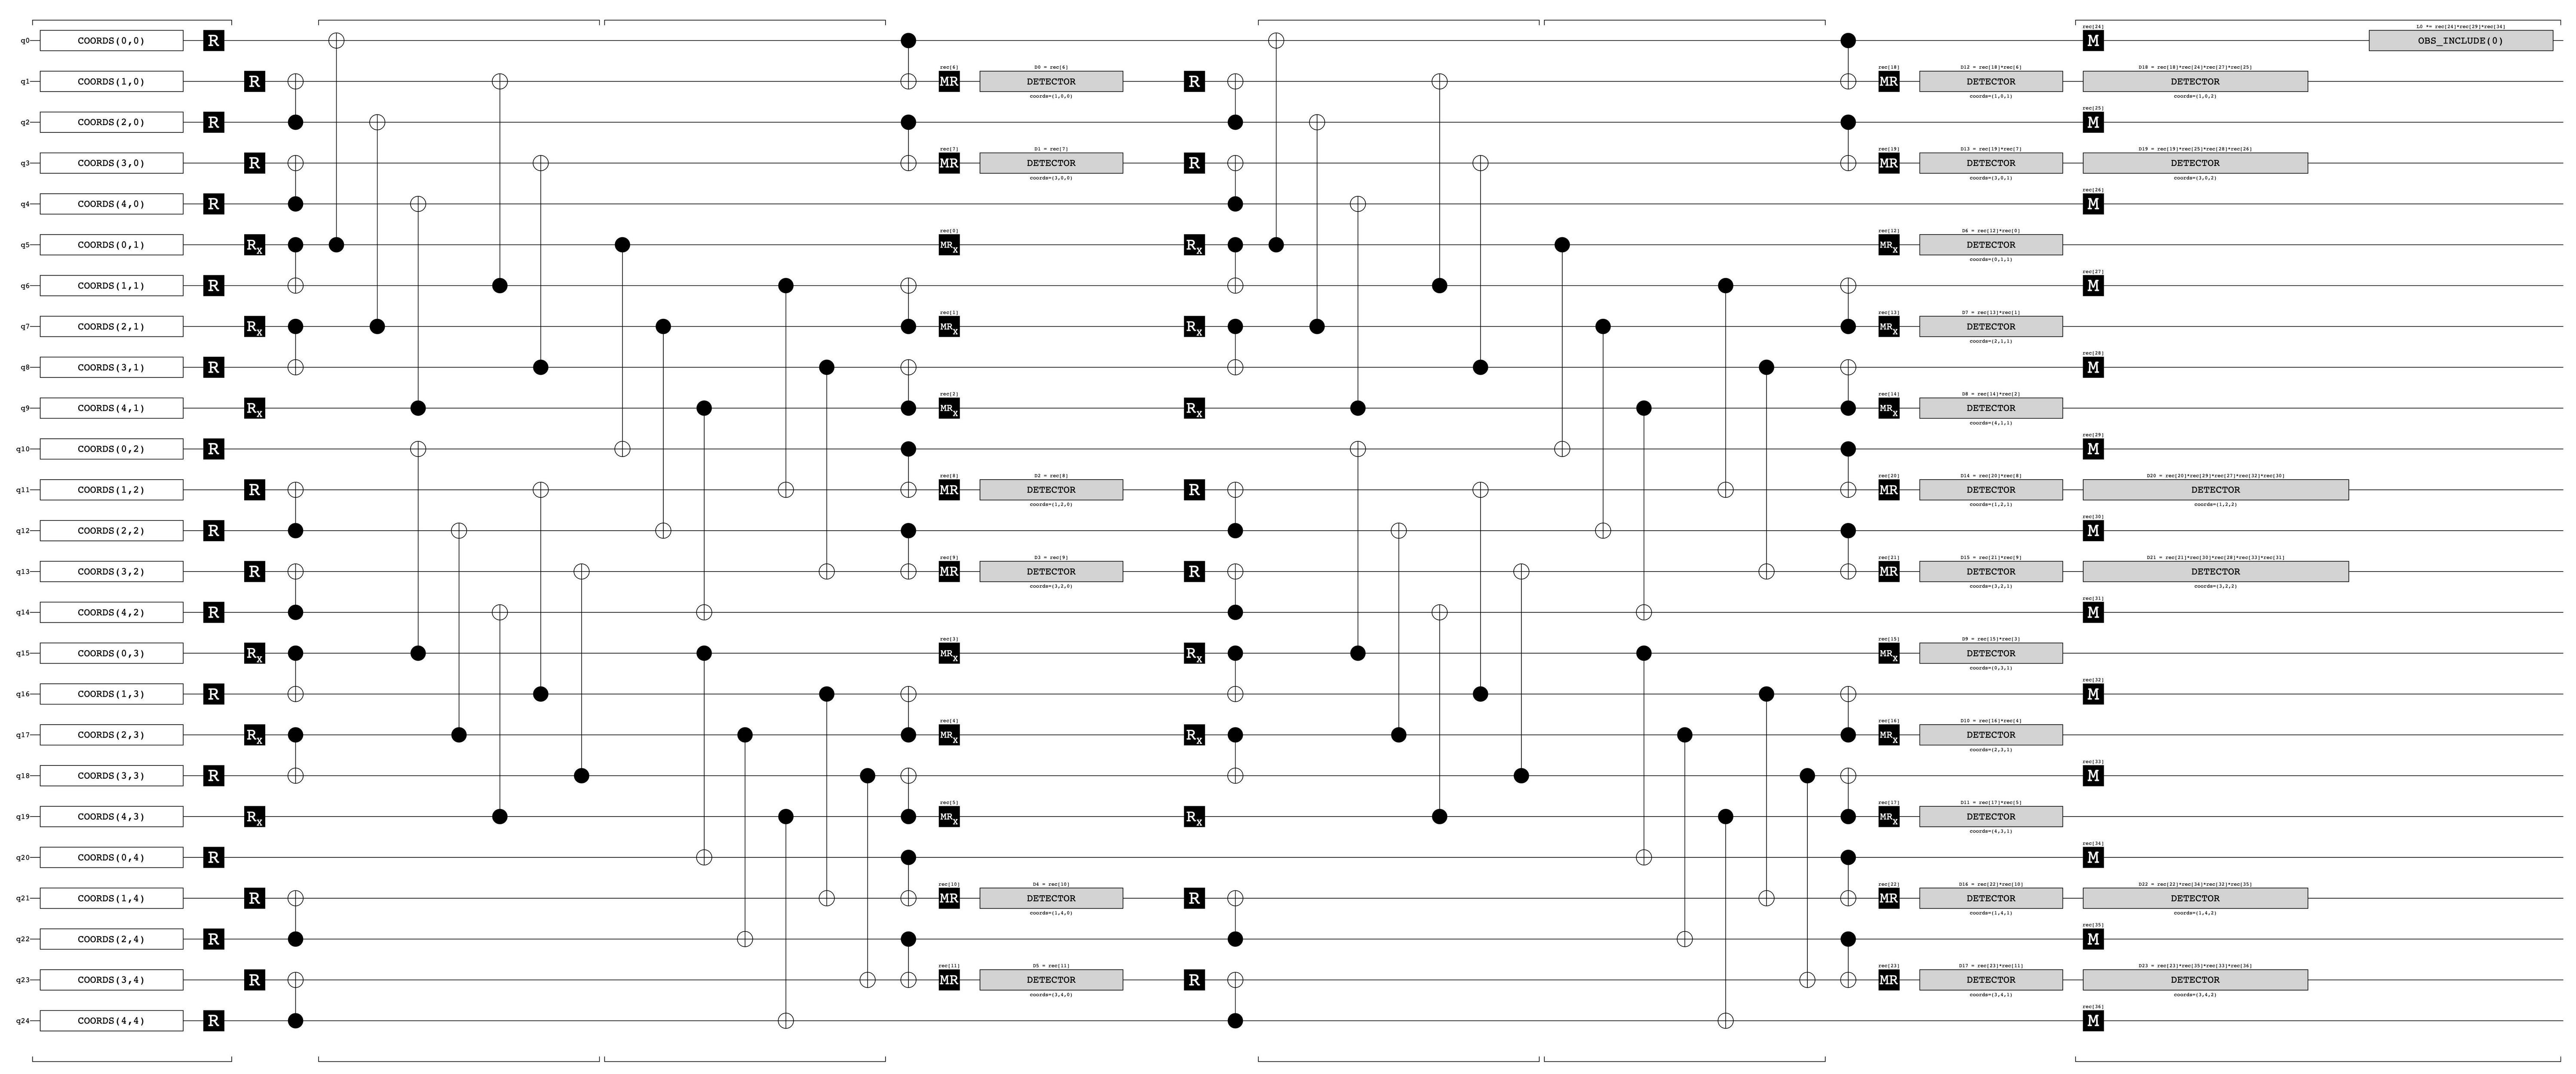
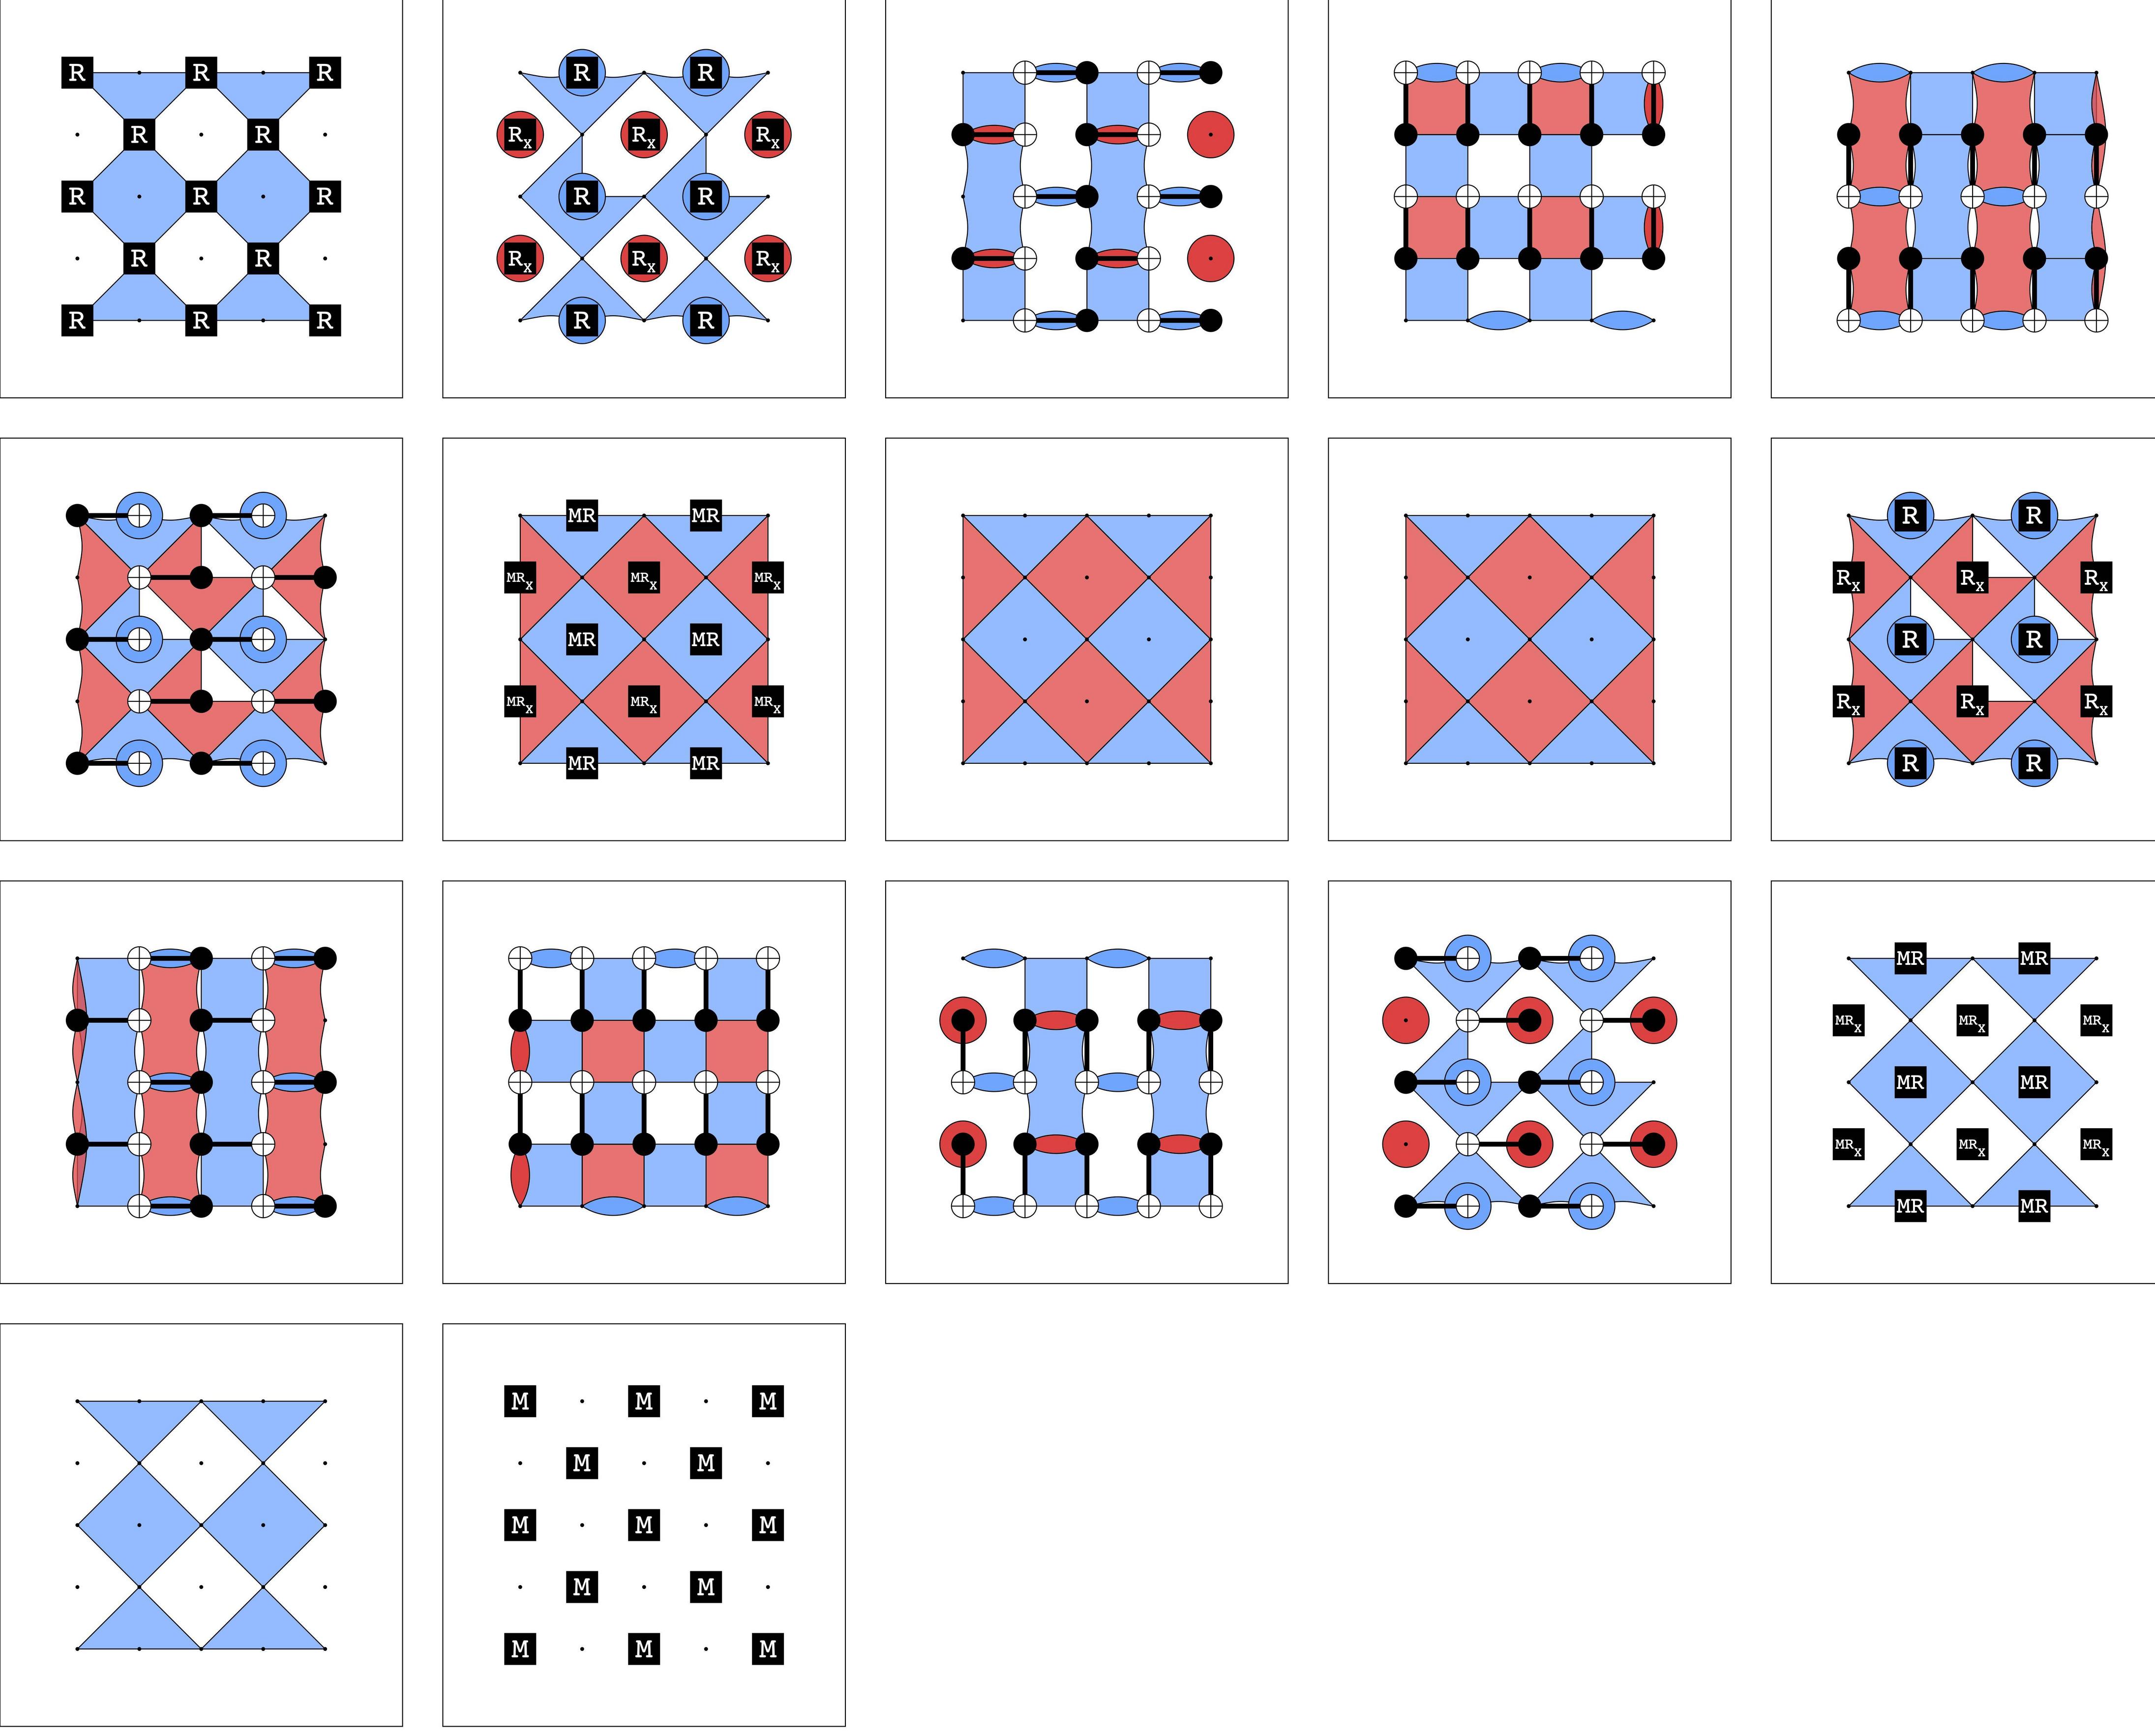
- What does these plots mean?
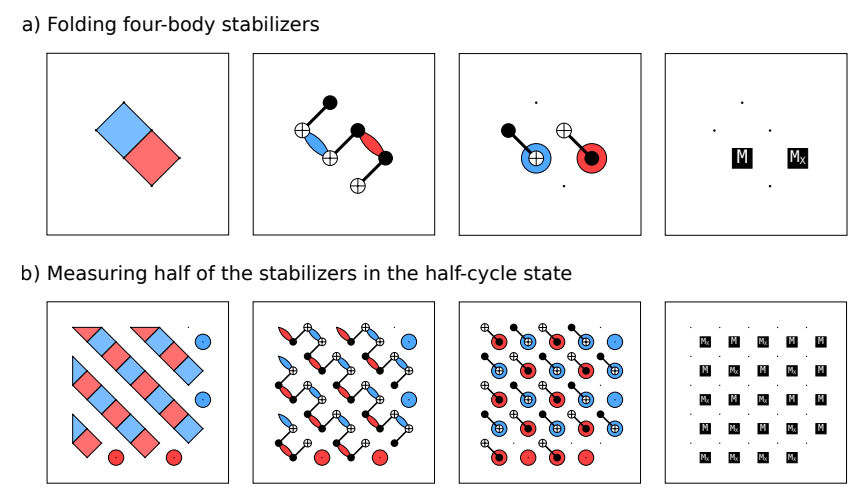
A detector slice diagram shows, at each moment in the circuit, the stabilizers you get by slicing through the detecting regions of the detectors declared in the circuit.
- Why in the second graph there are two blue squares each missing a corner?
Those stabilizers are from slicing the detecting regions of detectors that depend on the reset gate working correctly. The reset gate introduced a Z term into the detecting region, and so the four body stabilizer you get from slicing before the reset becomes a five body stabilizer when slicing after the reset, which is shown as a notched square instead of as a square.
- What do the big red and blue circles mean?
Those are single-body stabilizers.
- Do red and blue area mean Z and X stabilizers? And these areas' deformations mean stabilizer group transformation under unitary operations?
Yes, except red is X and blue is Z. The color convention is RGB=XYZ; red=X green=Y blue=Z.
- There are some curved edges and leaf-shape areas in some plots. What do they mean?
When three points in a stabilizer shape are lined up, it's hard to tell whether the middle point is included in the stabilizer or not. To disambiguate this case, the diagram code notices the problem and uses curved lines instead of straight lines when the middle point is included.
The "leaves" are two body stabilizers.
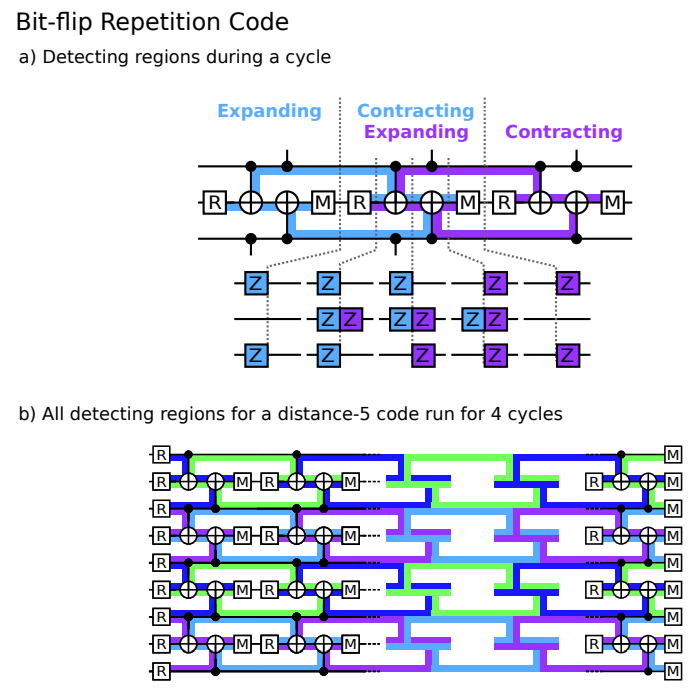
The notion of a detecting region is explained in "Relaxing Hardware Requirements for Surface Code Circuits using Time-dynamics" which includes some example figures.
A rep code example:
A partial surface code example:
A full surface code cycle example with extra details to make it clearer:
