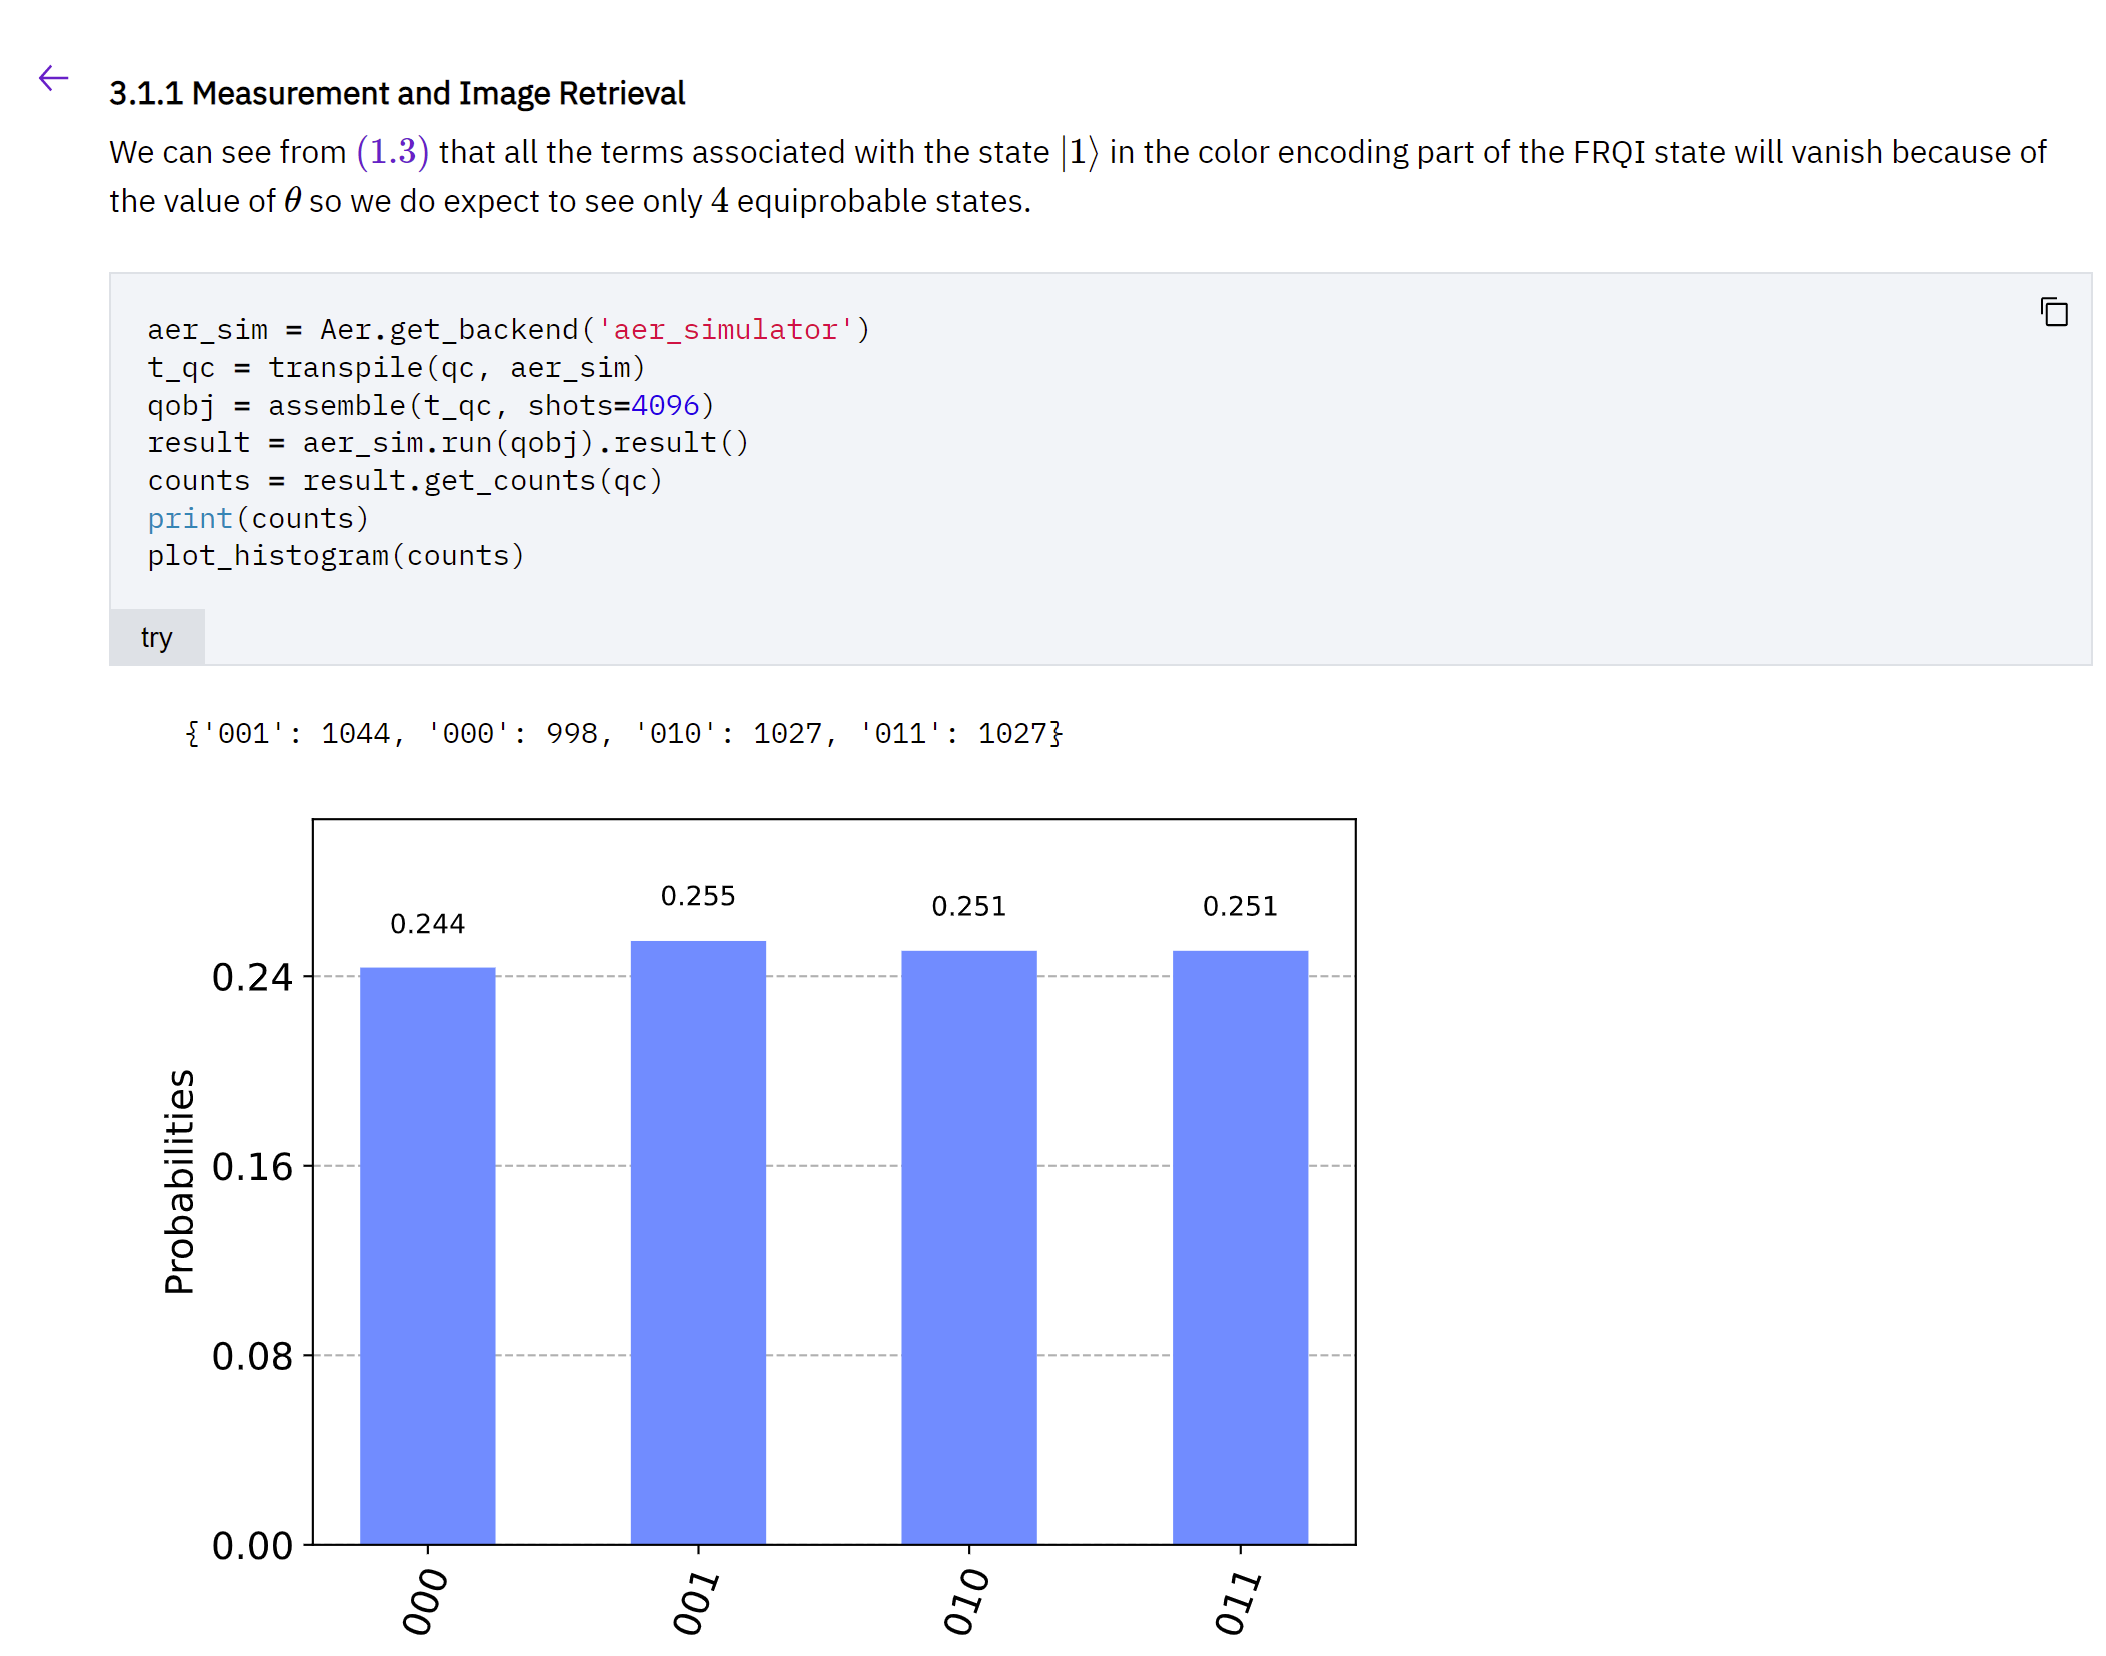
I am trying to understand the quantum image processing. Please refer the link- https://qiskit.org/textbook/ch-applications/image-processing-frqi-neqr.html. I am not able to understand how to process the histogram data(shown below) to form an image out of it. I know a little bit of matlab by which I can generate a image after reading the textfile data, but I donot not how to preprocess the below data so that it can represent an image.
1 Answer
$\begingroup$
$\endgroup$
The rightmost two bits of each string correspond to a pixel (e.g. 010 and 110 both correspond to pixel 10). The frequency we measure the string with a leading 1 tells us the intensity of that pixel.
Here's some quick code that decodes the counts dictionary:
for pixel in range(4):
    # convert to pixel number to bit strings, i.e. (00, 01 etc.)
    bit_str = f"{pixel:02b}"

    # Count no. of times we measure pixel string with intensity
    # bit == 1, and intensity bit == 0 respectively (if the string
    # doesn't exist in the dict, we default to 0).
    n_ones = counts.get('1'+bit_str, 0)
    n_zeros = counts.get('0'+bit_str, 0)

    # then pixel intensity ~= fraction of 1s
    pixel_value = n_ones / (n_ones + n_zeros)

    print(f"Pixel {bit_str} has intensity ~= {pixel_value}")
Pixel 00 has intensity ~= 0.0
Pixel 01 has intensity ~= 0.0
Pixel 10 has intensity ~= 0.0
Pixel 11 has intensity ~= 0.0
You can could store the pixel_values in a 2D array and use matplotlib's imshow to turn this back into an image. I think the page could be improved to show this.

