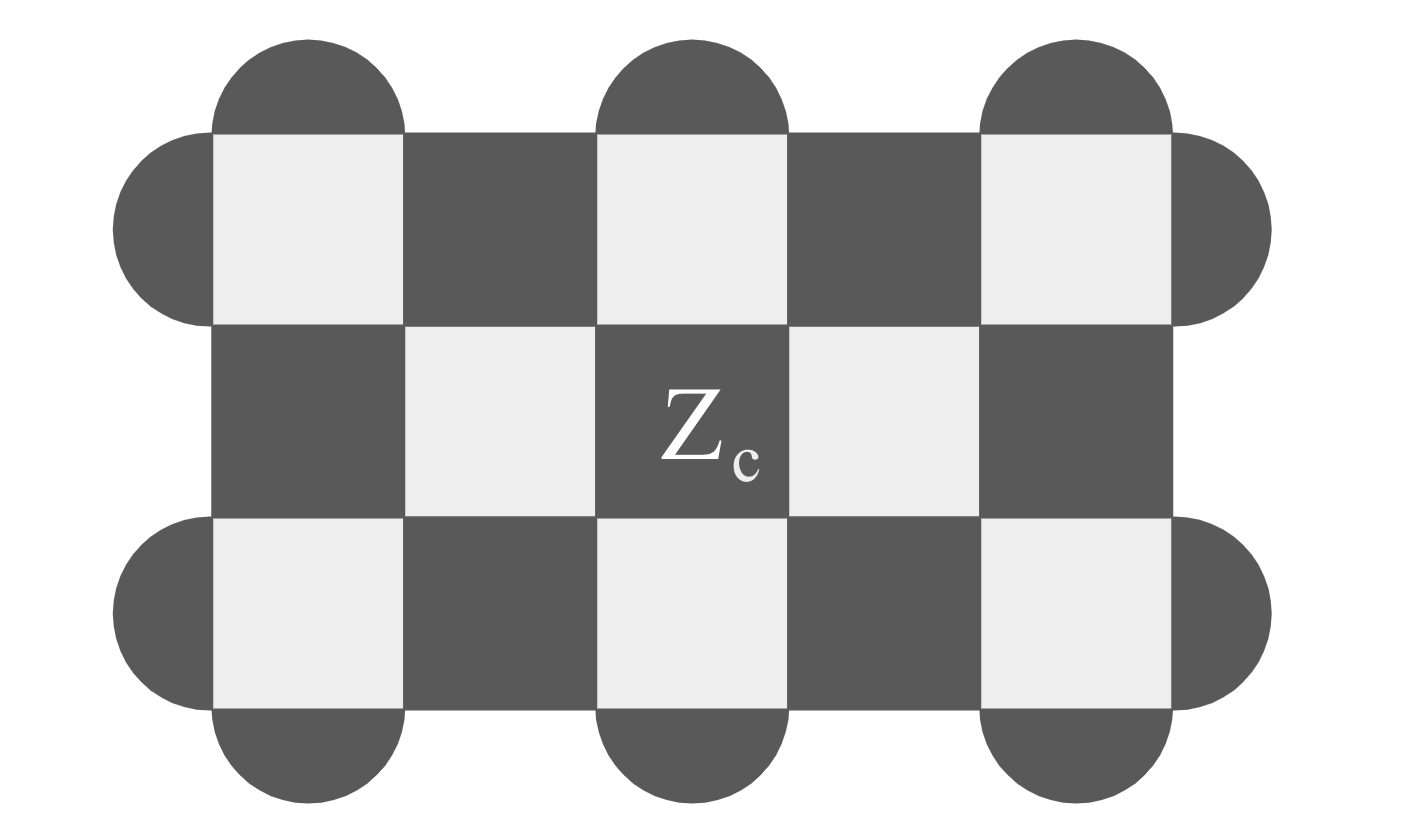
I am trying to understand to properly read the graph below, provided in this post
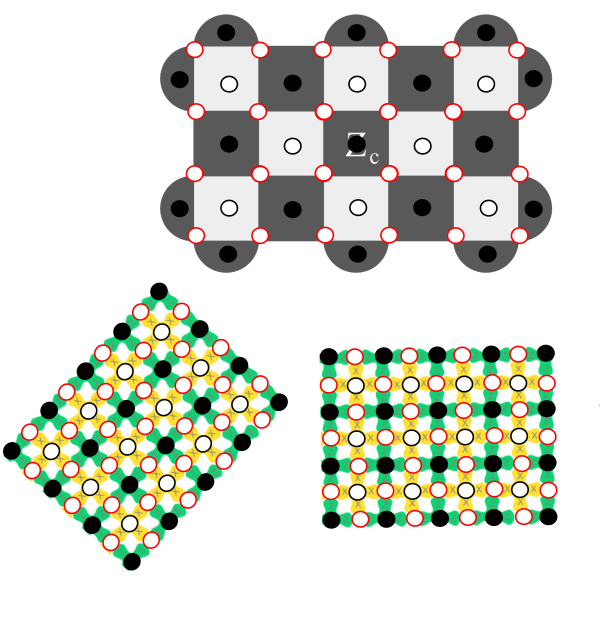
It is said that the black elements are the $Z$ stabilizers and the grey ones are the $X$ stabilizers. I am trying to make a connection with the physical positions of the data and measurement qubits. Below is my attempt (but I am confused).
The white circles with a red contour are data qubit, fully black circles are $Z$-measurement qubits, white circles (with a black contour) are $X$-measurement qubits.
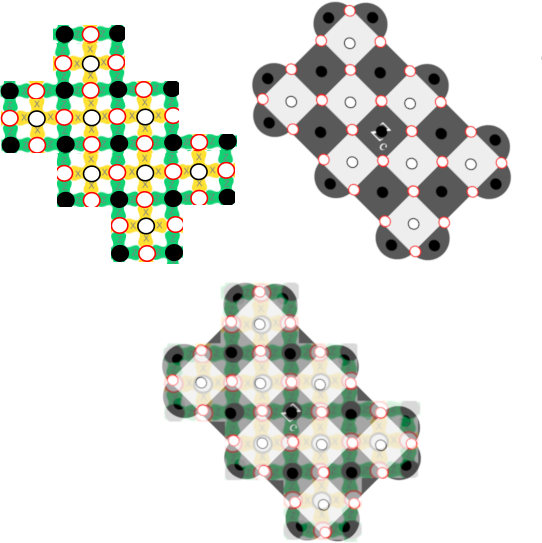
As you see, even by rotating of $45°$ the physical surface (given below) I cannot reproduce the upper pattern properly. For instance the $Z$ stabilizers at the boundaries are only connected to two data qubits (instead of three).
Hence, how to understand properly the upper representation in connection to the physical world?


